Decoding Dynamics: Visualising The Umbrella Academy
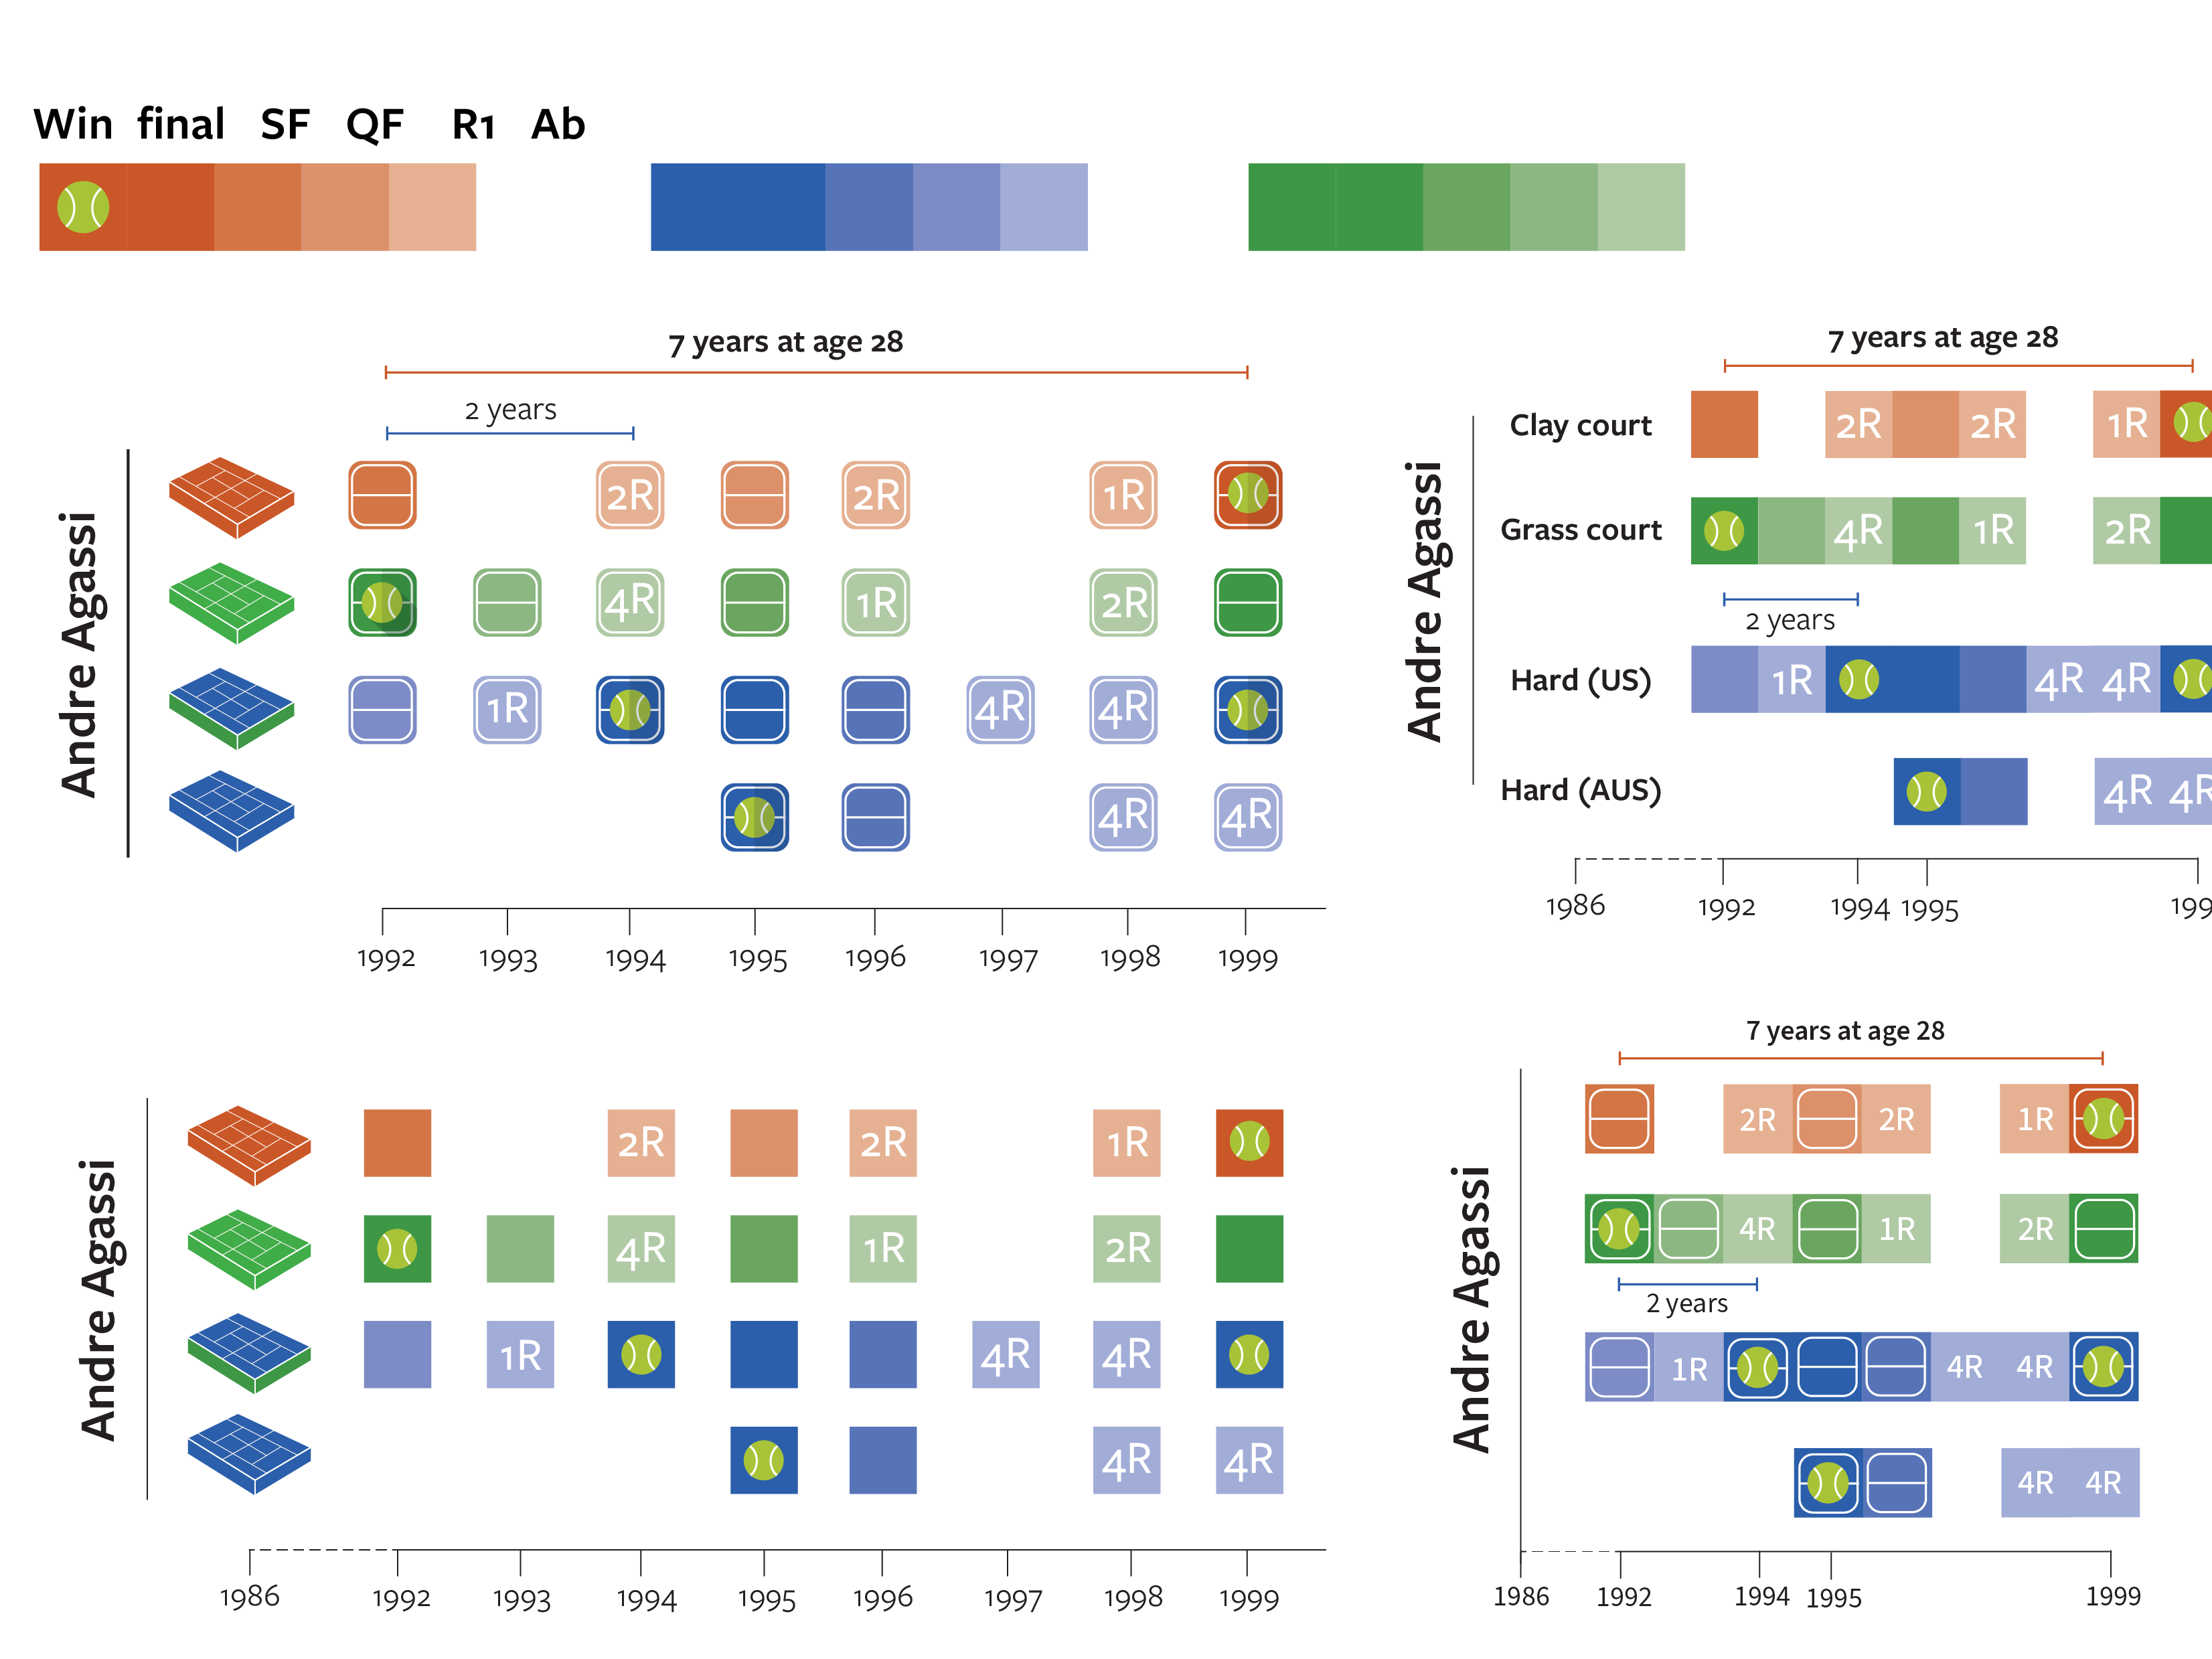
A data-driven project on The Umbrella Academy season 1. It focuses on pulling out small data stories from the series and then visualising them in the most efficient way. (In my opinion, efficient visuals include the maximum variables that can be incorporated while retaining accessibility for the readers.)


